
The Lein Lab specializes in neuroimaging. The journal NeuroToxicology chose these 4 images, submitted by lab members, to be on front covers in 2022. Congratulations Jason, Mei, Xiuzhen, and An!

Photomicrograph depicting dendritic and synaptic immunostaining in the stratum radiatum region of the CA1 hippocampus in a rat model of acute intoxication with diisopropylfluorophosphate (DFP). Biomarkers included microtubule associated protein 2 (MAP2; green), post-synaptic density protein 95 (PSD95; white), and synaptic vesicle glycoprotein 2A (SV2A; red) and nuclei were counterstained with DAPI (cyan). Filamentous MAP2 immunoreactivity corresponds to the apical dendrites of neurons, and the synaptic biomarkers (PSD95 and SV2A) correspond to punctate staining (spots). Areas where the pre- (white) and post-synaptic puncta (red) colocalize are considered to be synapses. The photomicrograph was captured under a 60x objective as z-series of images separated by 0.2 µm and containing approximately 6 µm of tissue. The z-series was pseudo colored and collapsed into a composite image using FIJI 1.53c (FIJI is just ImageJ; https://imagej.net/Fiji; NIH). Image generated by Jason Loxterkamp (University of California, Davis, CA, USA).
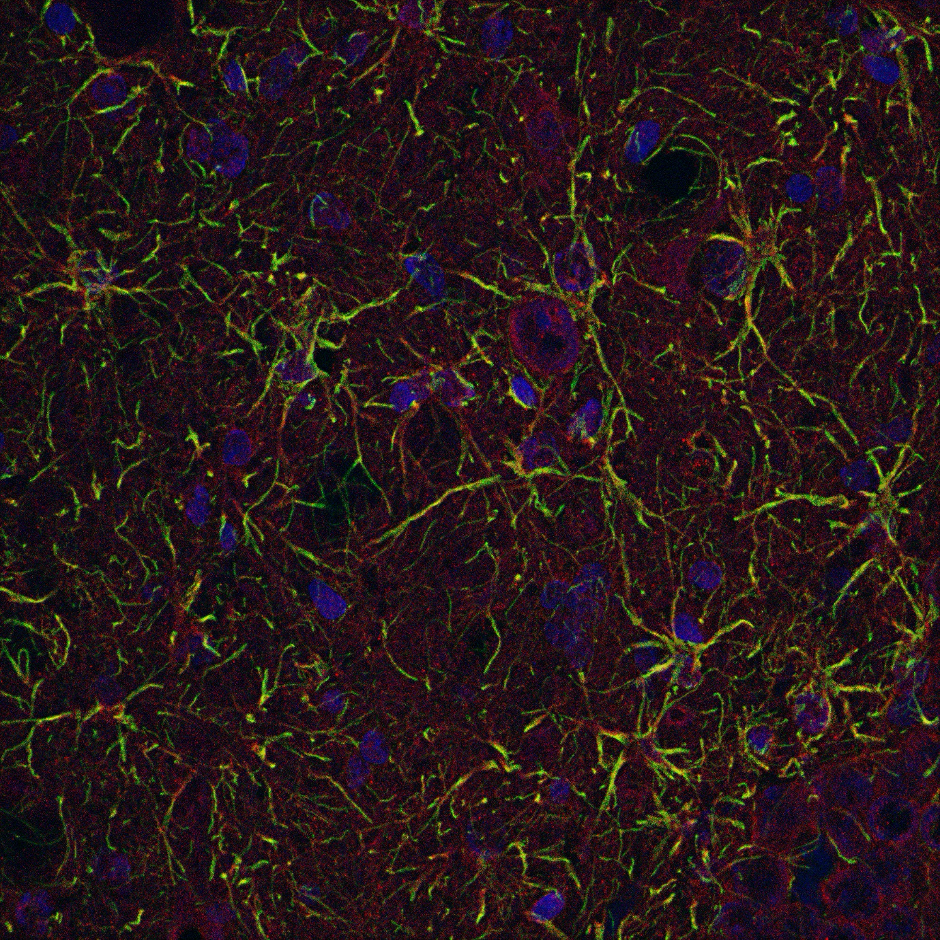
Confocal image at 60X magnification of astrocytic expression of PAI-1 in the hilus of the DG. This was also from a 15 mo Tg M Alzheimer's disease rat. Blue is DAPI, green stains for GFAP (astrocytic marker), and red stains for PAI-1. Image generated by Mei-Yun Tang (University of California, Davis, CA, USA).

Golgi impregnated glial cell (top left), pyramidal neuron (middle), and blood vessels (right) captured from the CA1 region of the hippocampus in a rat model of acute intoxication with diisopropylfluorophosphate (DFP). The Golgi Staining technique is used to visualize isolated, intact cells by random impregnation of structures with potassium dichromate and silver nitrate. Well impregnated cells are often visualized and photographed using brightfield microscopy. The photomicrograph was captured under a 20x objective as z-series of images separated by 0.2 µm and containing approximately 45 µm of tissue. The z-series was collapsed into a composite image using FIJI 1.53c (FIJI is just ImageJ; https://imagej.net/Fiji; NIH). Image generated by Jason Loxterkamp (University of California, Davis, CA, USA).


Micrographs of co-localization of CD68 (green) and IBA1 (red) immunoreactivity in the whole adult mouse brain treated with mecamylamine (top image) and pyridostigmine bromide (bottom image) 30 minutes before intoxicated with diisopropylfluorophosphate (DFP). Brain tissues were collected 3 days post-exposure of DFP. Brain section were labeled with DAPI(blue) to show cell nuclei and immuno-stained with both CD68 (green) and IBA1 (red) to identify activated microglia. Co-localization of IBA1/CD68 is shown in yellow. Scale bar =1000 µM. Immunofluorescence staining by Xiuzhen Liu and An Binh Nguyen, image generated by Xiuzhen Liu (University of California, Davis, CA, USA).